analyze
Track every question and
find gaps in your docs
Every question your customers ask is a signal. Kapa turns thousands of conversations into a clear picture of what your users care about, where they get stuck, and what's worth fixing first.

Capture every question
Every question customers ask, in their own words. Not a sample. All of it.
Find documentation gaps
Kapa shows you exactly where your docs are missing or fall short.
Prove the value
Tie deflected questions to tickets avoided and hours saved.

Know what documentation to write next
Coverage Gaps tell you what Kapa was uncertain about, and how to close the gap.
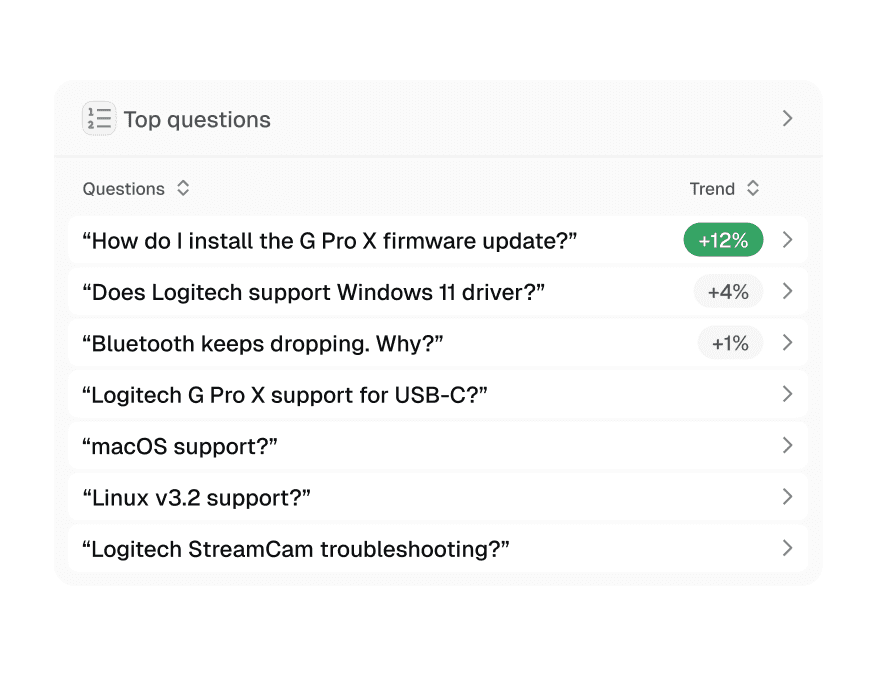
See what users really want
Reveal what customers ask for the most, and why
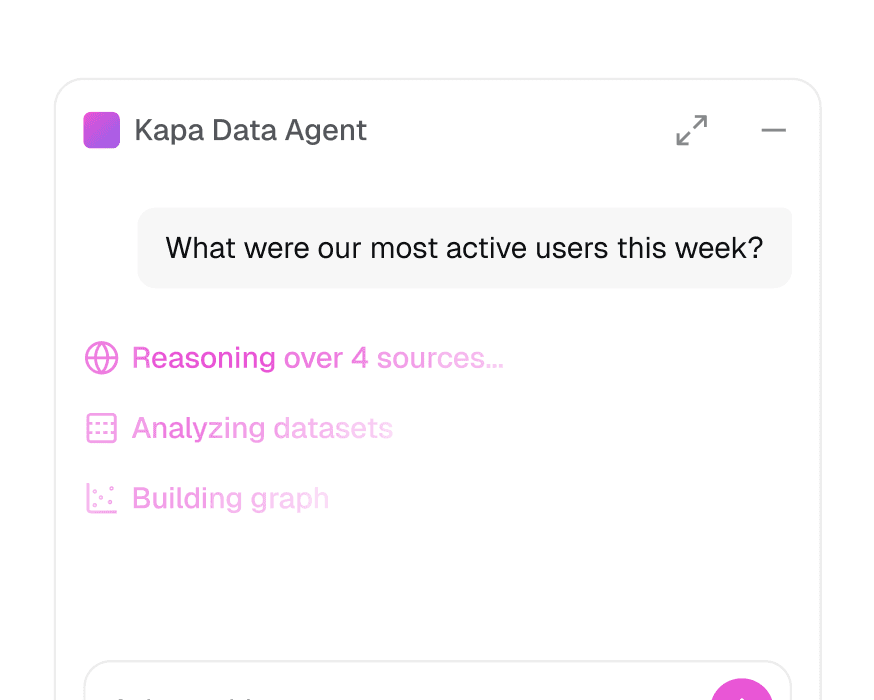
Data analysis at your fingertips
Ask the Kapa Data Agent anything in plain language.

Track ROI and deflection metrics
Measure deflection rate, tickets avoided and hours saved.
SOC 2 Type II
Independently audited and
compliant with SOC 2 Type II.
SOC 2
GDPR Compliant
Compliant with EU data
privacy regulations.
GDPR
SSO & RBAC
Single sign-on and
role-based access control.
Zero Data Retention & PII Masking
Detect and mask sensitive data
before processing.


Get a free trial
Test and evaluate Kapa for free
Go live in less than 7 days
SOC 2 Type II & GDPR compliant
What can I learn from Kapa's analytics?
Kapa persists every conversation across all your deployments, giving you a direct view into what your users are asking. You can see the most common questions, where your documentation is missing or insufficient, which features users want, and what they struggle with most. These insights help you improve your docs and inform product decisions.
What analytics tools does Kapa include?
Every deployment gets core analytics: a Dashboard of key metrics, full Conversations review and export, Coverage Gaps, Top Questions, Source Analytics, and scheduled Email/Slack reports. Website Widget deployments add User Satisfaction tracking and User Tracking to follow individual user and account journeys.
What are Coverage Gaps?
Coverage Gaps identify topics where Kapa frequently couldn't give a conclusive answer, pointing you to documentation and product gaps. For a chosen week, month, or quarter, Kapa clusters recurring uncertain answers and produces a Finding (what users asked and why Kapa fell short) plus an AI-generated Recommendation for how to fix it. You can export the clusters to CSV and work through them with an AI agent using the Analyze Coverage Gaps skill.
How is Coverage Gaps different from Top Questions?
Coverage Gaps focuses only on uncertain answers, so you can prioritize areas where Kapa currently can't help users. Top Questions clusters all conversations regardless of certainty, giving you a high-level view of the themes your users care about most.
What does an "Uncertain" response mean?
An answer is labeled Uncertain when Kapa determines there isn't enough information in your knowledge sources to respond confidently, usually shown as "Hmm, I do not have enough information." These responses are valuable signals for finding gaps in your documentation, either reviewed individually on the Conversations page or grouped in Coverage Gaps.
How are conversations organized and tagged?
Each conversation is automatically enriched with Intent Tags that classify what kind of conversation it is, such as Troubleshooting, Unsupported Feature, Competitor, Off Topic, or Uncertain. You can also define up to 20 Custom Tags to classify conversations by your own categories like product area, feature, or team, which is useful for routing questions to the right owners.
What is Source Analytics?
Source Analytics shows which parts of your knowledge sources are most frequently referenced when answering questions. It presents a tree view, from top-level sources (like your docs site or community forum) down to individual pages, so you can see what fraction of questions each piece of content answers and where to focus your documentation efforts.
Can I export my analytics or access them programmatically?
Yes. You can export conversations and Coverage Gaps to CSV with your filters and date range applied. Aggregate dashboard-style metrics (query counts, feedback, unique users, deflections) are also available through the Activity API endpoint. On top of that, scheduled email reports can be delivered weekly, bi-weekly, or monthly, and routed to a Slack channel.